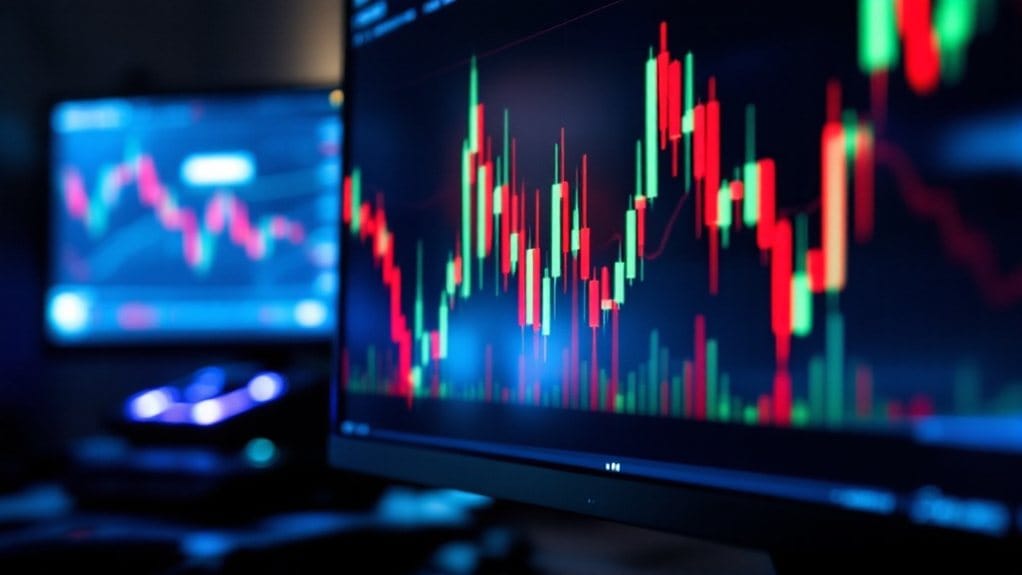
Candlestick charts display cryptocurrency price movements through visual elements comprising bodies and wicks, where the body shows opening and closing prices while wicks indicate high and low points. Green candles signal price increases, while red ones represent decreases, with varying wick lengths revealing market volatility. Traders analyze patterns like hammers, shooting stars, and doji formations to identify potential market trends and entry points. Understanding these foundational chart elements reveals deeper insights into market behavior and trading opportunities.
While cryptocurrency trading has transformed financial markets, understanding candlestick charts remains an essential skill for both novice and experienced traders. At its core, a candlestick consists of a body and wicks, with the body representing the opening and closing prices, while the wicks indicate the highest and lowest prices reached during a specific timeframe. In crypto markets, which operate continuously unlike traditional exchanges, traders rely on these visual representations to interpret market sentiment and potential price movements. These charts provide compact and clear illustrations of price history over varying timeframes. This visual approach to price analysis traces back to Japanese rice traders who pioneered the technique in the 18th century.
Mastering candlestick analysis empowers traders to navigate cryptocurrency markets effectively, transforming complex price data into actionable trading insights.
The color coding of candlesticks provides immediate insight into price action, with green candles indicating price increases and red candles showing decreases. Long wicks extending from either end of the body suggest notable price volatility during the trading period, while shorter wicks typically indicate more stable trading conditions. Doji candles, characterized by minimal body length, signal market indecision and often precede notable trend changes. Implementing dollar-cost averaging can help traders manage risk when acting on candlestick signals.
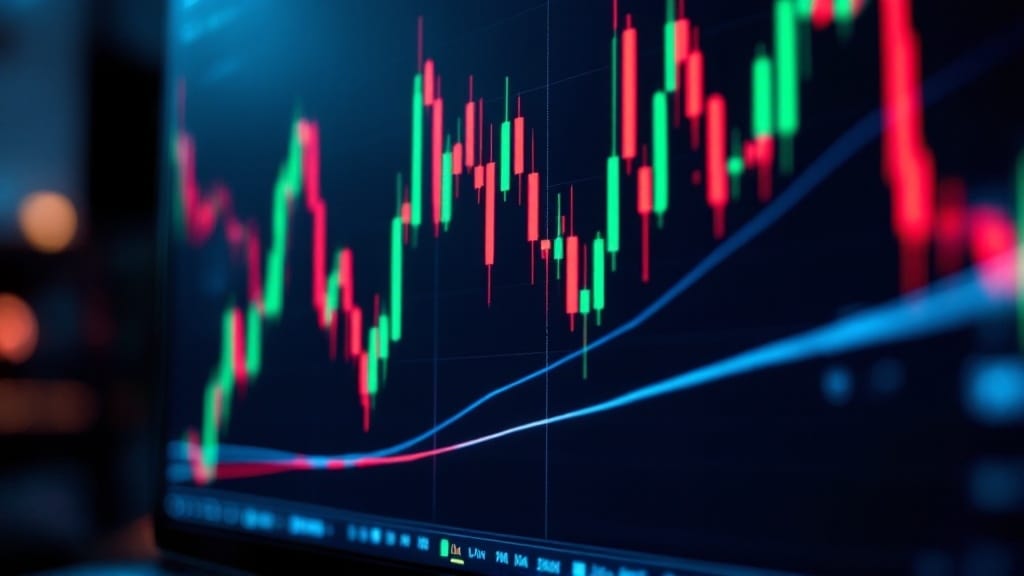
Traders particularly focus on specific patterns that historically indicate potential market movements. Bullish patterns, such as the hammer formation and bullish engulfing pattern, suggest upcoming price increases, while bearish patterns like the shooting star and dark cloud cover warn of potential downturns. The reliability of these patterns increases when multiple candlesticks form recognizable configurations, such as morning stars or three white soldiers.
Advanced pattern recognition combines candlestick analysis with technical indicators to create more robust trading strategies. Continuation patterns confirm existing trends, while reversal patterns signal potential direction changes, making them essential for timing market entries and exits. The context of these patterns within broader market conditions greatly impacts their reliability, as similar formations may yield different outcomes depending on prevailing trends and trading volume.
The strategic implementation of candlestick analysis in crypto trading extends beyond pattern recognition to risk management. Traders utilize this knowledge to set appropriate stop-loss orders and identify ideal entry points, while remaining mindful that no pattern guarantees future price movement in the volatile cryptocurrency markets.
FAQs
How Often Should I Update My Candlestick Charts When Trading Cryptocurrency?
The ideal frequency for updating cryptocurrency candlestick charts depends on the trading strategy employed:
- Short-term traders should update charts every 1-5 minutes.
- Swing traders benefit from hourly or 4-hour updates.
- Day traders typically require updates every 15-30 minutes.
- Long-term investors can manage with daily or weekly updates.
Market volatility and trading volume should influence update frequency, with periods of high volatility demanding more frequent monitoring to capture significant price movements.
Can Candlestick Patterns Predict Long-Term Cryptocurrency Market Trends?
Candlestick patterns alone cannot reliably predict long-term cryptocurrency market trends, as they are primarily designed for short to medium-term analysis.
While these patterns can identify potential reversals and momentum shifts, long-term trends are influenced by fundamental factors like regulatory changes, technological developments, and market adoption rates.
For accurate long-term analysis, traders should combine candlestick patterns with fundamental analysis, market indicators, and broader economic trends.
Which Timeframe Is Best for Analyzing Cryptocurrency Candlestick Charts?
Daily timeframes provide the most effective balance for cryptocurrency candlestick analysis, offering sufficient data granularity while filtering out market noise.
While intraday charts (1-minute to hourly) can benefit day traders, these shorter intervals often produce false signals due to increased volatility.
For thorough market analysis, combining daily charts with longer timeframes (weekly/monthly) enables traders to identify both immediate patterns and broader market trends.
Are Candlestick Patterns Equally Reliable for All Cryptocurrency Pairs?
Candlestick patterns demonstrate varying reliability across different cryptocurrency pairs, with major pairs like BTC/USD showing more consistent and reliable patterns due to higher liquidity and trading volume.
Lower-cap cryptocurrencies often exhibit erratic price movements and gaps in trading activity, making pattern interpretation less dependable.
Furthermore, market maturity plays an essential role, as established cryptocurrencies tend to follow traditional technical analysis principles more closely than newer, volatile assets.
What Software Offers the Most Accurate Cryptocurrency Candlestick Chart Analysis?
TradingView stands out as the most accurate platform for cryptocurrency candlestick analysis due to its real-time data integration with multiple exchanges and sophisticated technical tools.
MetaTrader 4 follows closely, particularly for advanced traders requiring precise algorithmic analysis.
Both platforms offer institutional-grade accuracy, with TradingView maintaining a 99.9% uptime and data consistency across major cryptocurrency pairs, while providing extensive pattern recognition capabilities through their proprietary algorithms.