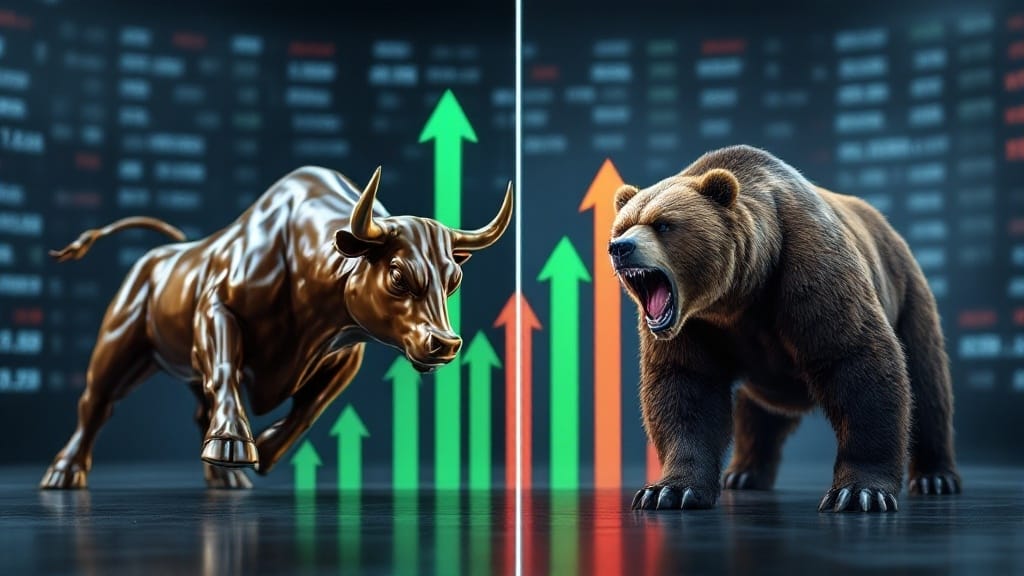
Bull and bear markets represent opposing trends in financial markets, with bull markets characterized by sustained price increases and optimistic investor sentiment, while bear markets exhibit persistent declines and pessimistic outlooks. Historical data indicates bull markets typically last 5.3 years with significant gains, as evidenced by the 391% S&P 500 rally from 1982 to 2000, whereas bear markets average 12 months. Understanding these market dynamics, along with associated investment strategies like growth-oriented approaches versus defensive positioning, provides crucial context for traversing market cycles.

The financial landscape is perpetually divided between two dominant market conditions that shape investment strategies and economic outlooks: bull and bear markets. These opposing market trends are characterized by distinct patterns in asset prices, with bull markets displaying sustained price increases amid strong economic conditions, while bear markets exhibit persistent declines often accompanied by economic downturn.
Historical data reveals that bull markets typically endure longer than their bearish counterparts, averaging 5.3 years compared to approximately 12 months for bear markets. During bull markets, investor confidence soars as corporate earnings grow and consumer spending increases, creating a self-reinforcing cycle of economic prosperity. This positive momentum is reflected in expanding GDP figures and low unemployment rates, which further fuel market optimism. The longest continuous period of market growth occurred over an eleven-year span from March 2009 to February 2020.
Bear markets, conversely, emerge when market sentiment turns pessimistic, often triggered by notable economic events or concerns. These periods are marked by at least a 20% decline from peak prices and feature heightened market volatility. Notable examples include the Great Depression and the 2008 financial crisis, which demonstrated how severe economic downturns can precipitate extended bearish conditions. Successful investors often employ portfolio diversification across various asset classes to protect against market downturns.
Investment strategies vary greatly between these market phases. During bull markets, investors frequently employ growth-oriented approaches, seeking to capitalize on rising asset values through early position entry. Bear market strategies, however, tend to focus on capital preservation through diversification into safer assets like bonds, or more sophisticated techniques such as short selling and inverse ETFs.
The supply-demand dynamics fundamentally differ between these market conditions. Bull markets are characterized by demand exceeding supply for securities, driving prices higher, while bear markets experience the opposite effect. The notable S&P 500 rally 391% during the historical bull run from 1982 to 2000 exemplifies the substantial gains possible during prolonged bullish periods.
These market cycles form part of a broader economic pattern that includes expansion, peak, contraction, and trough phases. Understanding these patterns enables investors to implement appropriate strategies, such as dollar-cost averaging, which can help navigate market fluctuations while maintaining long-term investment objectives.
FAQs
How Can Investors Protect Their Portfolios During Market Transitions?
Investors can protect portfolios during market changes through strategic diversification across multiple asset classes, including bonds, commodities, and defensive stocks.
Implementing stop-loss orders and maintaining adequate cash reserves helps minimize potential losses, while dollar-cost averaging smooths out price volatility.
Regular portfolio rebalancing, combined with hedging strategies using options or futures contracts, further safeguards investments against market uncertainties and directional movements.
What Role Do Market Psychology and Emotions Play in Bull-Bear Cycles?
Market psychology and emotions fundamentally drive bull-bear cycles through collective investor sentiment and behavioral patterns.
During bull markets, dopamine-driven optimism and greed fuel buying activity, pushing prices higher, while fear and panic dominate bear markets, triggering widespread selling.
These emotional responses, amplified by social media and cognitive biases like FOMO, create self-reinforcing cycles that influence market momentum and trading volumes.
How Long Do Bull and Bear Markets Typically Last?
Bull markets demonstrate considerably longer durations, typically lasting 3.8 to 4.2 years on average, with the longest recorded bull run extending 11 years from 2009 to 2020.
Bear markets, in contrast, tend to be shorter, averaging approximately 11 months in duration.
While economic conditions and market factors can influence these timeframes, historical data shows that bull markets consistently outlast their bearish counterparts by a substantial margin.
Can Individual Stocks Move Opposite to the Overall Market Trend?
Individual stocks can indeed move contrary to the general market trend due to several key factors.
Company-specific events, such as strong earnings reports or major product launches, can propel stocks higher during bear markets.
Conversely, negative developments like regulatory issues or poor financial performance can cause stocks to decline during bull markets.
Sector rotation, where investors shift between different industry groups, also contributes to individual stocks straying from broader market movements.
What Economic Indicators Best Predict Shifts Between Bull and Bear Markets?
Several economic indicators effectively signal potential market shifts.
GDP growth rates below 2% often precede bear markets, while consistent growth above 3% typically indicates bull conditions.
Rising unemployment rates, particularly sudden increases of 0.5% or more, frequently herald bearish trends.
Moreover, inverted yield curves, where short-term bonds yield higher returns than long-term ones, have historically predicted market downturns with 85% accuracy within 12-18 months.


